
Glasseye
Issue 4: August 2024
In this month’s issue:
The dunghill looks at one of the many ways in which GenAI is dummifying data science.
Some rarely given practical advice in Semi-supervised on applying machine learning to customer databases.
A look at Kolmorov-Arnold Networks and Ziming Liu’s admirable response to the hype in The white stuff.
Plus an obsession with Vale, a retreat to Vim, and Chernoff meets Pokemon.

Semi-supervised
This month, a question from a client, and one which gets to the heart of some common blunders in applied machine learning. The question is:
Can I train a single predictive model - say one that predicts the probability of retention - on my entire customer base, taking in everyone from recent acquisitions to loyal long-termers, and then use that model to score the base?
They would be forgiven, given the many blog posts on the subject, for thinking the answer is yes. But, as ever, it’s not that simple. Here are some problems:
What to do about the zeros: Among the inputs to our model, we probably want to include data on customer behaviour, usually captured as events (visited website, responded to offer) encoded either as ones and zeros or as counts. Unfortunately, the meaning of this data changes depending on the tenure of the customer.1 Just one visit to the website might be ok for a customer with a tenure of a week, but it’s pretty damning from a customer with a tenure of ten years. Zeros are an especially troubling case. What, for example, does zero mean for an event that is only possible after the first year of a customer’s tenure, such as signing up to a programme for valued customers? After the first year it may express disinterest in the programme, but in year one it means absolutely nothing. And what about the ones and zeros that record whether a customer has seen a video or a post that has since expired? For any customer who joined after the expiration, zero certainly does not indicate a lack of interest.
Instability in the early days: Another issue is related to the statistician’s favourite Law of Large Numbers. Say a customer has a preference for buying from the luxury goods section of an online store - a useful thing to know in predicting their overall spend. Our input variable is the percentage of all purchases made by the customer that are for luxury goods. After thirty or so purchases our variable is moving towards a reasonable estimate for the preference. But after one or two? To put it another way: what are we to make of a person whose purchases are 100% luxury goods after just one purchase, compared to a person whose purchases are 85% luxury goods after 100 purchases? Should the former case count as a stronger indicator of propensity to shop in the luxury goods department than the latter? Obviously not. The fact is that in the early days of a customer’s tenure, when the number of purchases is low, such variables have an annoyingly high variance and therefore need to be handled differently.
Data inequality: Power laws being everywhere in business data, the odds are that you have a database where most customers have done next to nothing, while only a small minority have the kind of event-rich data that grace Ted Talks and sales pitches. This means you’ll be asking a lot from one algorithm. You’ll be asking it to create one probably quite simple strategy for the data-impoverished majority and another very fancy set of moves for the data-rich minority. Being a people pleaser the algorithm will, unless you are lucky or give it some hints, probably side with the majority.
Rolling back time: If you are using machine learning to predict a future event (say another purchase in the next six months) then, unless all your input variables are unchanging over time, you will need to work from a historical snapshot of your customer database. In our case, the input variables (not the labels) will need to be rolled back to the values they had six months ago. Otherwise you may include among your input variables some that have changed their value within that six month time window. The new value might be highly predictive of the labels, but it won’t be available to the model when it is actually deployed.
So what can you do? One strategy is to hope that your algorithm is clever enough to figure out how to handle at least 1-3 in the above. It will create new features (dividing by tenure for example) so that event data is correctly interpreted; it will form interactions based on tenure to ensure that some variables are ignored if insufficient time has elapsed; and it will discover that prediction works one way for the data rich and another for the data poor. If you go this way then I strongly recommend that you build separate models for customers with different tenure ranges and then use these to check that your master model is not missing a trick (i.e. it doesn’t significantly underperform the separate models).
A wiser approach is to manually engineer features that will strongly hint to the algorithm that these problems need to be overcome. As mentioned above, division by tenure is an obvious way to go. Variables which capture whether an event was possible is another. Explainable machine learning techniques can then be used to investigate whether good use is being made of the features.
Another strategy is to question the wisdom of “scoring the base”. Instead of scoring everyone at once, all the time, trigger predictive models at various points in a customer’s tenure. The obvious first point is at acquisition. The second might be at three months. The third at six and so on. This gets rid of the tenure issues altogether since all tenures are equal for each model. Admittedly this might not work in every case but where it does it cuts out a satisfyingly large chunk of complexity.
Please do send me your questions and work dilemmas. You can DM me on substack or email me at simon@coppelia.io.
Thanks for reading Glasseye! Subscribe for free to receive new posts and support my work.

The white stuff
I’ve been reading the original paper on Kolmogorov-Arnold Networks and I can see why it has caused so much excitement. In a nutshell, KANs give us a network in which the edges represent functions, and the nodes, summations of those functions. (Compare this to MLPs where the edges represent weights, and the nodes, functions of summed, weighted inputs.) An animation that says it all can be found in the readme of the pykan package.
The appeal, for me at least, is that it leads to a description of the output variable as a mathematical formula made up of nested elementary functions on the input variables. That and the interactive and highly visual way in which you arrive at the solution.
Equally interesting is the fact that the principal author of the paper and package, Ziming Liu, felt it necessary to distance himself from the hype that followed his publication, and defend himself against the backlash that presumably followed when the reality did not match the inflated expectations. He does this with a lot of class.
I plan to test it out using data from the simsets API as described in the July issue.

The dunghill
Earlier in the week I was sent an entertaining reminder that generative AI may just as well drag us down as lift us up.
The following message appeared in my LinkedIn notifications: “You're one of a few experts invited to answer: Here's how you can use logical reasoning to uncover insights in large datasets for business decisions.” Putting aside the crass appeal to my vanity, there is something odd about this question. There’s formal logic, which, in the form of predicate calculus, is important for certain specialised areas of AI, and then there’s just being logical, as in consistent and attentive to logical implications. The question does not seem to be referring to the former, and there’s no useful “how” for the latter. (Yes there are formal ways of checking the logic of arguments but I’ve yet to meet anyone who sits down and double-checks their reasoning using symbolic logic.)
Now, we are all developing a nose for GenAI fakery and this smelt funny. Sure enough when I clicked the link…
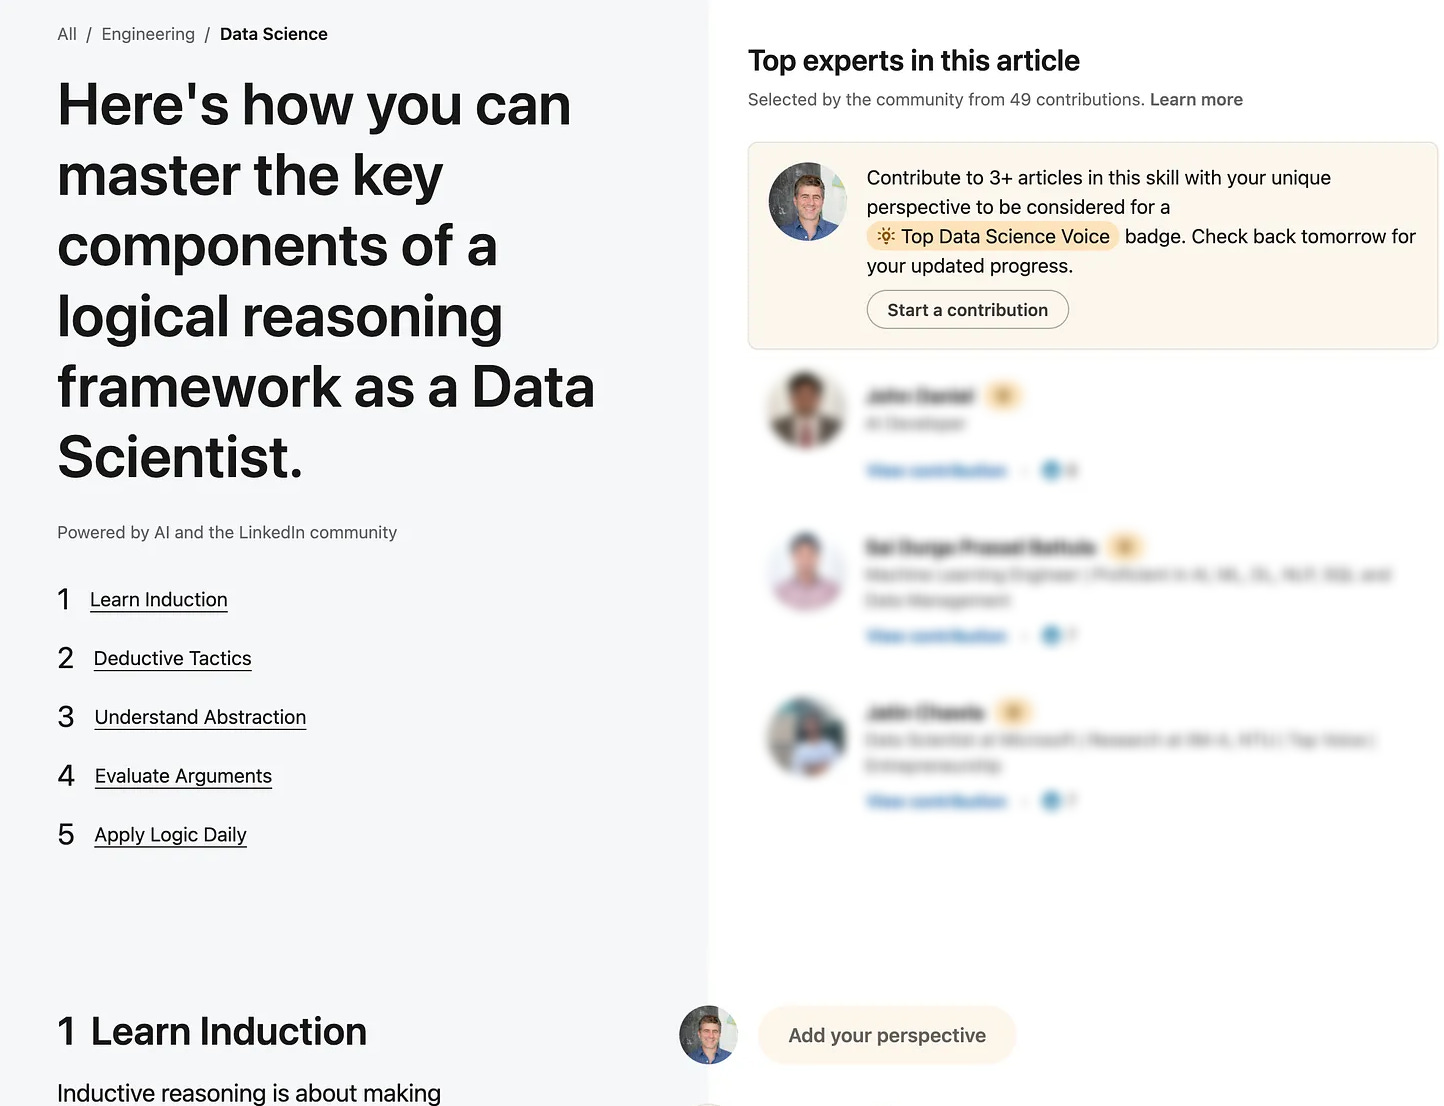
Note the “Powered by AI” small print. Here’s my guess at what is happening: One LLM prompt asks for a list of questions that we might ask an expert in data science. Further prompts ask how an answer to each question might be structured (steps 1 to 5 in the screenshot). At this point the LLM must have drawn on a billion self-help and secrets-of-success posts. I can only say, if you’ve not yet learned induction then you are going to have trouble walking around the room. And step 5 is my favourite: achieve data science mastery through regular daily practice of logic. Wax on, right hand. Wax off, left hand. Only then will you be ready for the next level!
I guess the plan here is that the auto generated content acts as a kind of fly paper, luring in aspiring data scientists and then leaving them dangling on the righthand side (out of kindness I have blurred them out). They are meant to provide the human-generated fill for the AI-generated outline.
But the problem is that GenAI sent them off in the wrong direction to begin with, and these unfortunate experts appear to be giving their human stamp of approval to that path into nowhere.
Let’s hope this thread goes no further, and let’s especially hope it is not used to train the next round of LLMs.
If you have some particularly noxious bullshit that you would like to share then I’d love to hear from you. DM me on substack or email me at simon@coppelia.io.
From Coppelia
Vale and Vim
A new tool this month and a very old one. Vale is a prose linter which I’ve become a little obsessed with. It’s an option to replace Grammarly that is open source, free and puts you in control of the rules. If you are fussy about your prose, have frequent arguments with Grammarly, and feel the need to write your own rules (so that you can then chide your future self for breaking them), then this is probably what you are looking for.
Unfortunately I then noticed that Vale had a plug-in for the text editor Vim, which took me back to a puritanical world where the keyboard is king. When stressed I like to strip away every last gui component and revisit the early eighties. Vim is that place. If you’ve never tried it then you must.2
Old faces
Finally, and gratuitously (I can think of no good reason for doing this) I’ve been playing with Chernoff faces. If you have not come across them before, Chernoff faces were an early attempt at the visualisation of multidimensional data by mapping variables to facial features.

Thankfully this inspired person has written a python function to revive them. To take the pointlessness to a new level I applied the function to the Pokemon data set, effectively creating new Pokemon - only more rational, since their attributes are mapped directly to their features.
The fruits of my labour…

Code can be found here.
If you’ve enjoyed this newsletter or have any other feedback, please leave a comment.
The amount of time that has elapsed since the person first became a customer.
I figure that if I finally learn to touch type and I master Vim then I will be as close to superhuman as I’m going to get.
My guess has been that LinkedIn is doing a Quora — encouraging search engine-friendly content to increase its ad inventory. It offers very clear incentives to writers; as I understand it, a user can earn “expertise” and “leading voice” badges that help them stand out in jib candidate and media searches.
Notably, several users have taken the (obvious, really) next step of using an LLM to generate their answers. It’s entirely possible to establish oneself as a leading voice without any domain knowledge.
Secretly, I love this, and despair of my friends who volunteer to become serfs in LinkedIn’s content farm.