
Glasseye
Issue 13: May 2025
In this (first anniversary!) issue:
The last word (maybe) on synthetic respondents in the now thoroughly deserved dunghill.
Semi-supervised invites you to consider a world where points are spaces and spaces points.
We investigate the old-school magic of directed graph layouts in the white stuff.
Plus, how I broke up with conda over uv, and the brilliant but temperamental willow.

Semi-supervised
Back in December, I promised to use this space to provide you with tips for solving real - as opposed to textbook - problems. Over the last six months we’ve considered ontologies, room-tidying, concept-mapping, feasibility (via AI environments) and toy-problems. We’re not out of steam yet. This month we are thinking about space, and points in space, and the point of points in space.
Points in space are of course the bread and butter of any statistician/data scientist. We cluster them, we rotate them, we separate them from one another, we fit lines, planes and hyperplanes to them. All the more reason, then, to give them careful consideration. And by that I do not mean delving deeply into the mathematics - that’s what the textbooks are for - I mean something much more basic and probably for that reason more often neglected: I mean thinking about what they represent in any one problem.
I feel all the more justified in this statement of the obvious now that the word of the moment is embeddings. Embeddings are, after all, points in a space, and if we forget, or don’t care, what the space and the points mean, we'll get utterly lost.
But this is not about embeddings. It’s about the absolute basics, merely a reminder to ask yourselves the following: What in your ontology do the points represent—people, organisations, images, concepts, sounds? And how do you interpret the space between them?
Take as an example a scenario where points are customers in a space where the axes are attributes such as annual spend, number of purchases, age, gender, etc. The most immediate and intuitive interpretation of this space is to interpret nearness as similarity. But to make this work, variables must be scaled, and the correlation between variables accounted for.
All this is quite basic (although crucial and often forgotten in the rush to do something more exciting with the data). Less familiar, but rich in its problem-solving potential, is the possibility of flipping points and axes: that is, making the columns of your data set the points in a space defined by the rows. In the example given above, points are now customer attributes in a space where each axis is a customer. Nearness in this space, as long as the variables are standardised and mean-centred, means something like correlation. In fact, cosine similarity in this space is equivalent to correlation. Thinking in this more unusual space can lead to surprising insights into, for example, the workings of linear regression and the meaning of degrees of freedom.1
But from a practical perspective, this space-point flipping is more useful when the original variables (columns) share enough in common for a more distinct interpretation once they are recast as points (rows). To use the classic example, a dataset of viewers and movies watched, can be flipped from viewers in the movie-space to movies in the viewer space.
With enough practice you can learn to see every data set as two datasets. For example:
A survey is a set of questions that can be plotted in a respondent space, as well as a set of respondents that can be plotted in a question space.
An image data set is a set of images that can be plotted in a pixel space as well as a set of pixels that can be plotted in an image space.
A document dataset is a set of n-grams that can be plotted in a document space as well as a set of documents that can be plotted in an n-gram space
And of course these two spaces are really just the starting point. For various purposes each can be rotated, transformed or projected into spaces of lower or higher or even infinite dimensions. But none of this fancy stuff will be at all useful if you haven’t carefully thought through the meaning of point and space in the most basic of cases.
Please do send me your questions and work dilemmas. You can DM me on substack or email me at simon@coppelia.io.

The white stuff
I’ll admit to being slightly obsessed with the mermaid diagram layout - feeding it with ever more complex graphs just to witness the beauty of the output. The magic, it turns out, is well documented in this classic paper from 1993: A Technique for Drawing Directed Graphs by Gansner et al, which was the inspiration for both the dagre package (on which the mermaid layout is built) and the graph layout for GraphViz. It’s also an object lesson in problem solving: the problem is clearly defined; several competing aesthetic objectives are laid out; the task is broken down into four stages; and then each subtask is tackled by drawing on an impressive range of mathematical and algorithmic techniques (the network simplex algorithm, barycenter functions, splines, etc.).
Mermaid have just added an alternative to dagre: the ELK layout. It’s very pretty (see below), although I think I like it for trivial reasons (it’s easier to read the labels on the edges). The only relevant paper I could find was The Eclipse Layout Kernel by Domrös et al. It’s a little thin on detail. If anyone finds something more substantial, please let me know!

The dunghill
I (almost) promise that this will be my last word on synthetic respondents. If I’m more strident now than I was ten months ago, then this is partly because in July last year I did not really believe that people would fall for it. But it’s happening. Even the most absurd of use cases is gaining traction. As I pointed out in this thread, “in its most ludicrous form, the claim is that [synthetic respondents] can get you access to ultra high net worth individuals who otherwise would not answer your survey. Bear in mind that LLMs are trained on web data, and there's only one UHNWI I can think of who is weird enough to spend his time plastering the internet with his opinions… But the big worry is that where businesses go, governments follow. Do we really want government policy to be built on LLM mush derived from internet mush? And I worry that the patter about using synthetic respondents to replace hard-to-reach groups will be ultimately applied to hard-to-reach vulnerable groups.”
This comment prompted the accusation that I am a) some kind of market research reactionary who winces at the very thought of change, and b) someone with a vested interest in the status quo. I wrote a long reply to my accuser, which was completely ignored. I think it does a good job of summing up my argument, so here it is in full:
Hi Tony, I am very sympathetic to your point about resistance to change. I admit that there is a great deal of inertia in the market research sector. I'm not sure if by "people" you mean me. Hopefully not, but anyway, I can put your mind at rest here. I don't work in market research, and market research companies only form a very small fraction of my clients (and those that are my clients tend to be pretty forward-looking). So there's no vested interest here, and I think I can say the same for most of the respondents so far on this thread. If there's an interest, then it's the one I stated above. I worry that bad decisions will be made in important areas (government policy, medicine, etc) because decision makers have been blinded by the hype surrounding AI.
I have to push back also on the idea that my objection to synthetic respondents is based on "nothing but gut feel". Here's my argument which you are welcome to pick holes in.
To compare like with like, assume that we are comparing good-quality old-school research with a conscientious use of synthetic respondents. For the first we have some theory (central limit theorem, etc.) that connects the sample to the population, and, provided some assumptions are met, we know how wrong we might be when making estimates based on the sample. We also have a pretty clear idea of where it falls short (biased samples, multiple comparisons etc).
I don't think anyone would claim that there is this kind of theoretical understanding when it comes to synthetic respondents. We don't know how the training data relates to the population (other than the fact that, as web data, the population created it), and we know very little about the incredibly complex rules that have been learnt by the model and which apply when a response is generated.
But potentially this doesn't matter if, as you say, we take an empirical approach to validating the process of synthetic respondents: i.e. we re-run existing human-based surveys on the equivalent synthetic respondents and compare the two. If, after many such comparisons, we find that, say, 80% of the time the synthetic respondents produce near enough the same results then we can say to someone using synthetic respondents that the chances are that their results are also a good match.
Against this I am arguing (here) that what is valuable in research is the information you discover that is surprising; something that a competitor is unaware of since it is not common sense, or something that would force you to change business processes, or treatment or policy because it goes against what everyone has always assumed. So for me a good test of synthetic respondents would be to take some existing research, ask the consumers of that research to flag the findings that they did not expect, and which are significant for them, and then look at whether these patterns are also found among the synthetic respondents. So if there's any "gut feel" going on, it’s just that I don't think LLMs are going to be very good when it comes to this test.
But anyway, I am offering a method for falsifying my gut feel, so if synthetic respondents turn out to be consistently good at replicating valuable findings, I'll be happy to admit I'm wrong! Lastly, I'd say we've got good a priori reasons for asking for this level of validation. We can easily think up situations where synthetic respondents could be formed from extremely inappropriate content. In the trauma scenario, which was discussed in the thread above, the material might be violent fantasies rather than testimonials. And if clients have the self-discipline to treat the results as "directional" and the information is consequential, they will need to validate it using a sample of real people, which gets us back to where we started.
Still waiting to hear from Tony.
If you have some particularly noxious bullshit that you would like to share then I’d love to hear from you. DM me on substack or email me at simon@coppelia.io.
From Coppelia
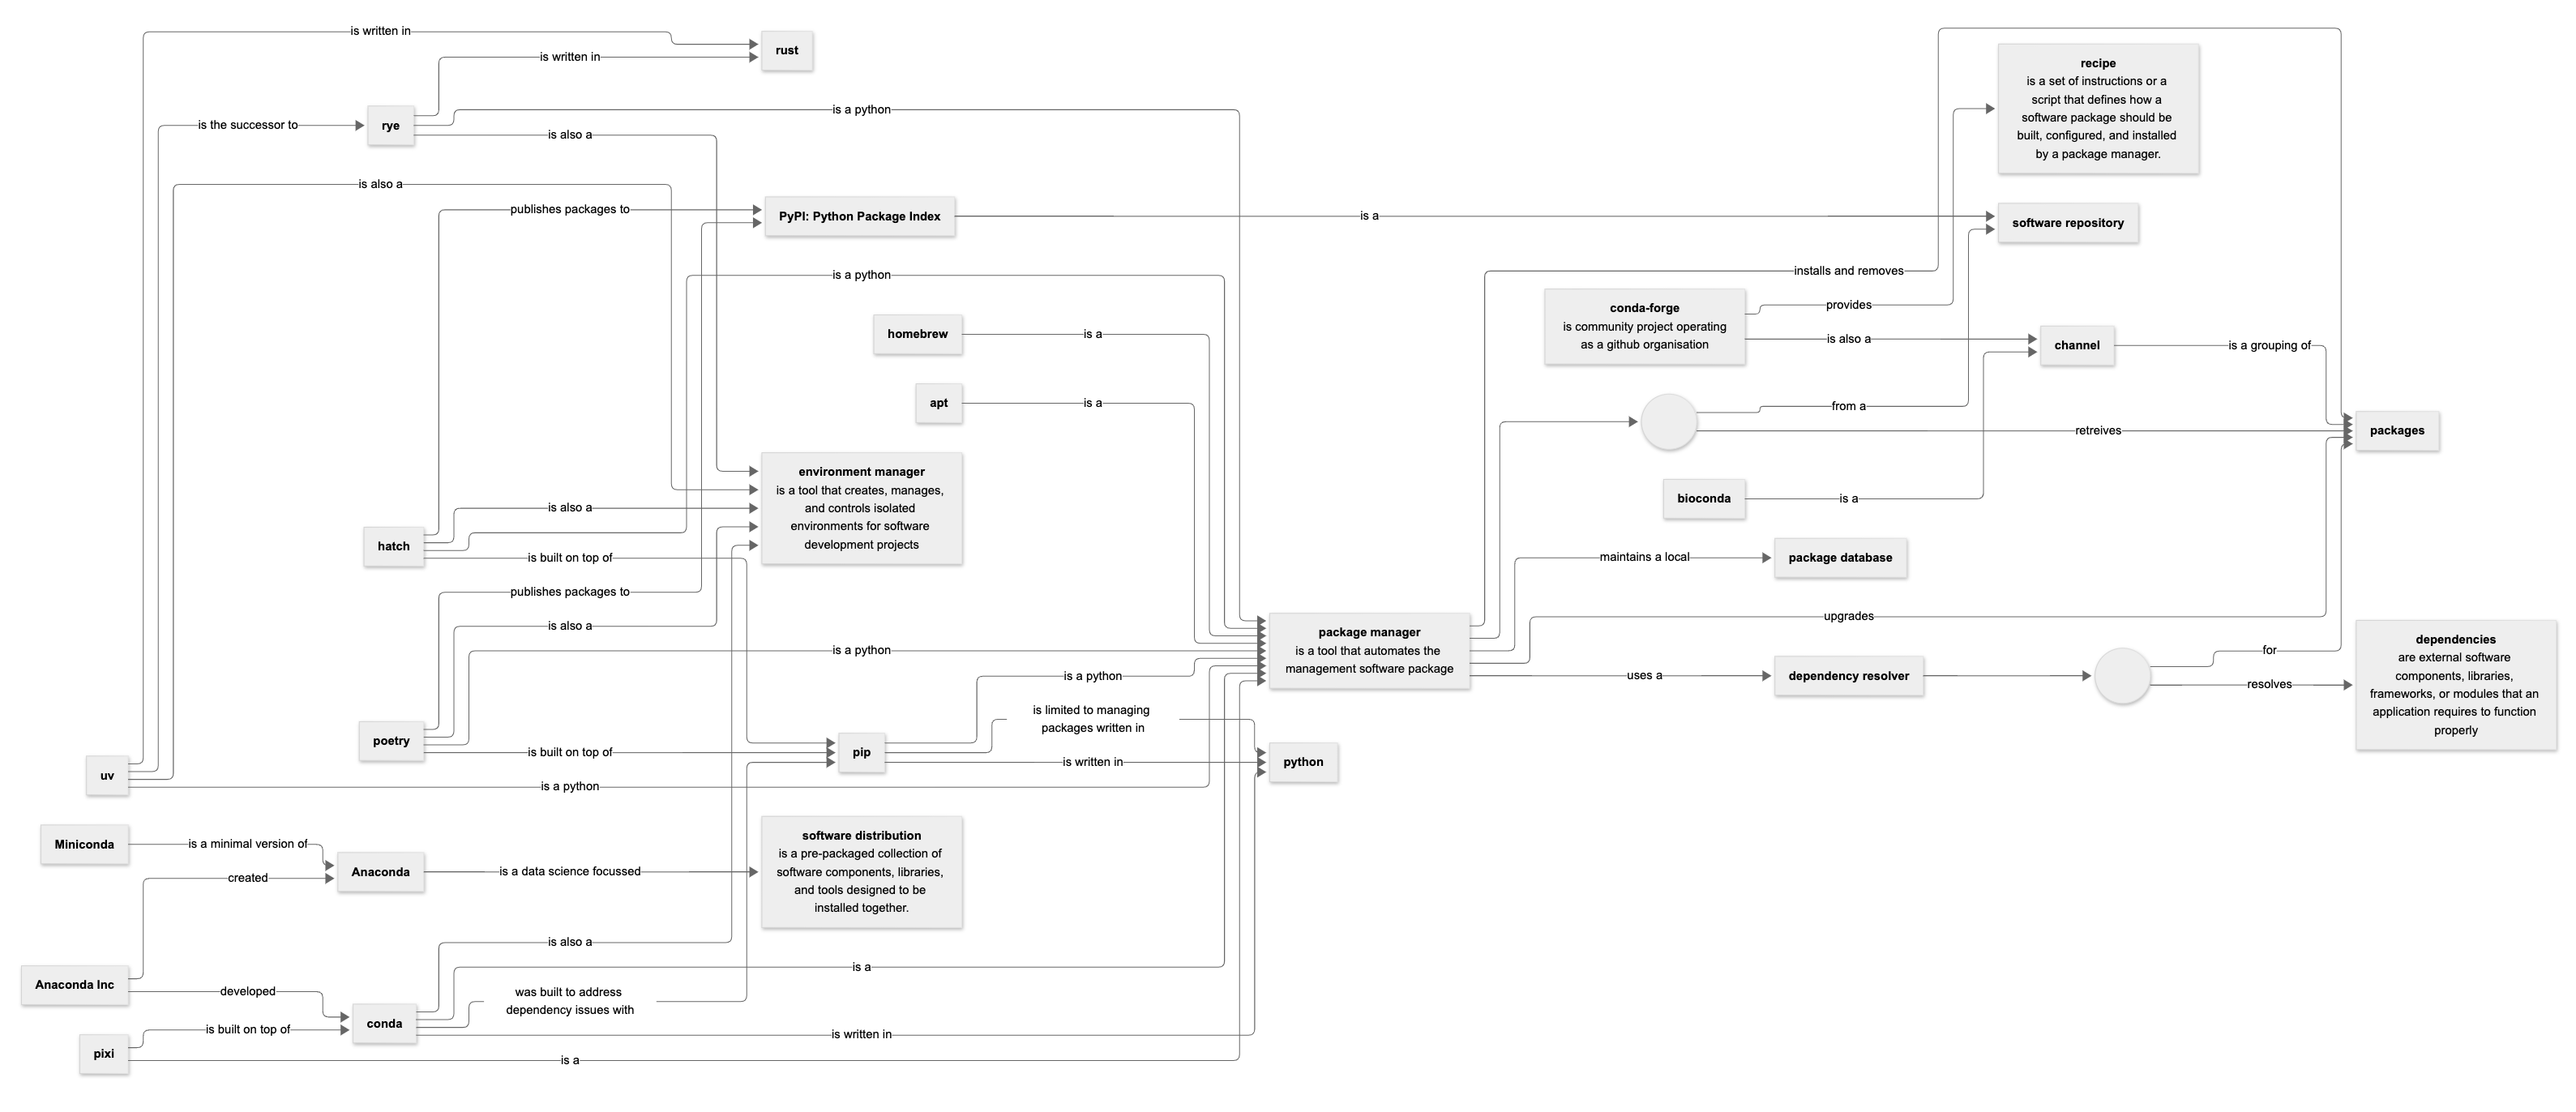
This month I have, like many others, fallen for uv2, the new rust-based Python package manager. It’s like a hot knife through butter. So after a relationship of more than ten years, I’m breaking with conda. (If I’m honest it’s been over for some time.)
This prompted a Mermaid concept map (using the new ELK layout discussed above) on the topic of Python package managers, which I'm sharing here in case it's useful.
My regular supplier of anything on the cutting edge, Mark Bulling, has put me on to Willow, a genAI-powered dictation tool that removes the friction of dictation by revising and punctuating our mumblings. It’s brilliant, but as you'd expect, sometimes thinks it knows better. So you have to watch it
If you’ve enjoyed this newsletter or have any other feedback, please leave a comment.
Linear regression on a dataset of N rows can be understood as a projection from an N-dimensional observation space to a subspace of N-k-1 dimensions.
Thanks to Søren and Jonas for the recommendation!
very enjoyable Simon- much appreciated!
Thanks Piers! Hope all is well with you!