
Glasseye
Issue 1: May 2024

Welcome to the first ever issue of Glasseye. If it were print it would go straight into a polypropylene bag! As promised the focus will be on the practice rather than the hype, the doing not the selling. This month’s contents: a couple of short articles, and what I hope will be some regular Glasseye features including:
Semi-supervised: an agony uncle (sounds so very wrong) column where I answer whatever nasty statistical questions or tricky work dilemmas you send me.
The white stuff: my pick of the white papers out there - some old, some new but all essential reading.
The dunghill: a chance for some group catharsis - we let the air in on some of the bullshit and bad practice you’ve shared over the years (keep it coming by the way).
So, without further ado…
A Bayesian trick buried deep in the pages of Gelman
At the bottom of page 215 of Andrew Gelman’s classic textbook Bayesian Data Analysis there is an understated result which from a practical perspective is gold.
This is a simple formula for the posterior distribution of the difference between two means in a randomised test. The posterior distribution will be approximately normal, with a mean equal to the difference between the two sample means and a variance equal to the sum of the sample variances multiplied by two and divided by the sample size. It’s the Bayesian version of the Central Limit Theorem trick that gives us the t-test for differences between sample means.
Why is this so useful? Because it gives us an incredibly fast way to compute the results of a Bayesian A/B test where the outcome variable is continuous1 - useful quantities like spend and dwell time. And thanks to the Central Limit Theorem this works even if the distribution of these quantities is unknown.
For your day job this means the following: you can completely drop the frequentist approach to A/B testing in favour of a Bayesian approach - which means you get all the benefits of the Bayesian world without the extra hassles of simulation.2
A reminder of those benefits:
No more talk of p-values, confidence intervals, null hypotheses, power, minimum detectible effect, type one and type two errors. No more blank faces. No more embarrassing attempts to put the inexpressible into words!
Instead, just the probability that variant A is better than variant B.
Even better these probabilities can be transformed directly into the terms of the business decision. For example, the probability that variant A will be more profitable than variant B.
On top of this, Bayesian A/B testing hands us some serious methodological efficiencies from smaller sample sizes to early stopping.
For me this is an overwhelming victory for the Bayesians. I can no longer see any advantages in the frequentist approach to A/B testing. Let me know if you disagree!
Stealing ideas from neuro-symbolic AI
The proposition of neuro-symbolic AI is simple. The connectionist approach to AI (neural nets, in all their forms, right up to LLMs) is phenomenal at certain tasks and awful at others. The same is true of the older symbolic approach, where goal-based problems are solved by applying rules to symbols representing information. Happily though, the two approaches compliment one another: where one fails the other excels. So why not bring them together?
There have been some fruitful attempts to do just this: see here, here and here. I find the Concept Learner by Mao at al. particularly magical since it simultaneously learns both how to pick out objects from images, and the language needed to answer questions about those objects. Moreover it learns like a child, building up first simple object attributes (shape, size, colour), then relations (to the left of, in front of) and then finally the capacity to break down complex problems.
From a practical perspective, this opens up some new directions for those of us struggling to do useful things with large language models. Instead of hoping that they will do the whole job, we might begin by assuming that the LLM will be an equal partner in a wider system. Hitzler et al. have identified several different approaches to neuro-symbolic AI:
Incorporate symbolic abilities into the neural approach. The idea is to improve performance on reasoning tasks without radically departing from the neural paradigm. Strictly speaking, this is less a neuro-symbolic strategy and more a connectionist attempt to do it all. But at least it acknowledges the problem. This one though is unlikely to be for us since it requires a large R and D budget.
Couple the neural and symbolic components. This is a lot more promising since it fits the workplace reality of having to work with an out-of-the-box LLM. We can break the approach down into four subcategories:
Use the neural component to extract features that are then used by the symbolic component. For example the neural component might recognise objects in an image leaving the symbolic component to reason about the objects.
Use the symbolic component to explain or justify the reasoning of the neural component (a good way to think about countering LLM hallucinations).
Call a neural model at some step in a symbolic algorithm.
Use the neural component to extract symbolic rules which are then used by the symbolic component.
I’d argue that all four are fruitful directions to explore - with prompt engineering just an interface between the LLM and a rule-based algorithm.
Sometimes through, when wrestling with LLM output, a more cynical thought creeps in: symbolic AI failed in the past partly because it was bad at interacting with an unpredictable world. And now we find ourselves building rule-based systems to handle LLMs that are just as unpredictable. Might we be back where we started?

Semi-supervised
This month’s question is from Andrew Scarff at TUBR:
“I'm looking into the best metrics for comparing time series models. We've been using them but we're finally implementing MLFlow and want to automate the comparisons so I'm trying to get a better understanding of them all. I came across this webpage, and for RMSE3 it states:
However, RMSE is not easy to interpret, as it does not have the same unit as the original data.
And all of the contributions say the same thing. But in my head if you square the differences, average them, and take the square root, then you end up in the same units. Just wondering if you could help clear this up for me!”
Thanks Andrew. I really like this question as it gets to the heart of the way statistics handles variance. The answer rests on something extremely counterintuitive, best illustrated with an example:
Take a set of square tiles of assorted sizes, calculate the average tile area, and construct a new square tile with that area. Then the length of a side of this new square is not equal to the average side length of the original tiles. To put it more bluntly the square with the average tile area is not the square with the average side length. In fact, only if the tiles were all equally sized would this be the case.
The cause of this aberration is the distribution of the side lengths of the tiles. Say we had three lengths: 2, 2, 2. The average length is of course 2 and the result of the squaring-averaging-square-rooting operation is also 2. But redistribute the units so that we have 1, 2, 3 (while the average side length remains the same) then
Since for positive x the gradient of the x2 function is ever increasing, any redistribution of the units that preserves the mean is going to lead to an increase in the overall value. Yes, we’ve gone from 22 to 12 but we’ve also gone from 22 to 32.
Substitute side lengths for errors and the same sequence of operations - squaring, averaging and taking the square root - is at work in the RMSE. And likewise the RMSE fails to return to its starting point.
Please do send me your questions and work dilemmas. You can DM me on substack or email me at simon@coppelia.io.

The white stuff
The first of this month’s papers is controversial but nevertheless a classic. Why Most Published Research Findings Are False by John Ionnidis stoked up the replication crisis in 2005. You’ll be surprised at how much devastation is caused by a few simple equations. Corollaries four to six seem particularly relevant for today.
For the second paper, we go back to where it all began: Improving Language Understanding by Generative Pre-Training. Yes Generative Pre-Training… GPT. It’s a very clear exposition of the fundamental ideas, and it is fascinating to see how limited the original ambitions were. One of the break through ideas was to standardise supervised tasks by turning them all into the problem of predicting the next few lines of text. Obvious now but not so much then.

The dunghill
Our monthly portion of excrement comes from a data scientist who got in contact after reading my Bullshit Jobs in Statistics article. This unlucky graduate landed not one but two classic bullshit roles in succession.
Her first job was at a business she calls Company A. Here she took over the management of a set of predictive models that were supposed to identify fraudulent transactions.
After a few months, one of the clients realised that the "predictions" were essentially random. At this point, it became my problem to fix the system. But.... I couldn't fix it: without a clever proxy to infer whether a transaction was fraudulent, I had no way to obtain a useful volume of labelled data to evaluate whether I was "improving" things. Moreover, I suspected that the inane data that we did collect was simply not predictive of whether a transaction was fraudulent. It was shocking to me that of the ten clients, only one of them seemed to be checking whether the predictions they were paying for were accurate or not! Why weren't the other companies bothering to check the "predictions" they were being served? Why were companies even buying this product if it didn't matter whether it worked? It was hugely demotivating to me to realise that as long as the salespeople in my company could sell, it didn't matter if I built a tool that worked. It also bothered me that the company was willing to sell a product without infrastructure to get feedback on wrong predictions in a way that would make the performance transparent to the clients. I think this willingness to prioritise sales ahead of ensuring the product worked was a symptom of more general dysfunction at the company. I departed from that job thinking that I'd simply been unlucky.
Knocked back but not completely demoralised she took up a more promising position:
I took a job at Company B because they offered me the chance to work on machine learning research. I made it clear during my interviews that I was happy to work on other projects and within a few months of starting, I parachuted into a project where - never mind labels - they had no data whatsoever - and they were already pitching the product, complete with fake performance statistics, to customers of some of their other product lines. I was horrified and asked for a meeting with the engineering manager for the company. I told him that selling an untested product that was complete fakery had the potential to do a lot of damage to the reputation of the company's other products. He agreed with me... and... nothing changed. I started job-hunting again, but I wonder now if I should have looked around for a regulatory body to report the company to.
Later she reflected on what might have been the real motivation behind her recruitment:
I feel like my job was not really to train and improve ML models, but to legitimatise the company's products in the eyes of colleagues who worked on other aspects of the business and who trusted me that the product did what the company claimed! At Company A, I was asked explicitly not to talk about the performance of the product to people outside the data team. I also feel that companies used my performance in public machine learning competitions as a way to launder the reputation of their product to their clients and investors. I wonder now if Company B was willing to let me work on research partly because publishing and conferences meant that my reputation became a proxy for the reputation of the company.
In the Graeber nomenclature the first job - a tale of pointless predictions - combined the roles of Box Ticker and Goon, the second - a sham research programme and a sham product - was more a case of Flunkey and Goon.
That was in the autumn of 2023. I caught up with her recently. How are things now?
I'm still sailing around in the career doldrums. I'd love to figure out some clever way to make companies lose money when they externalise costs by selling crappy "predictive" tools, but barring that, I'm happy just to live frugally with integrity and autonomy over my life.
Respect.
If you have some particularly noxious bullshit that you would like to share then I’d love to hear from you. DM me on substack or email me at simon@coppelia.io.
From Coppelia
In case you missed it I released a package called…
Timeline AI
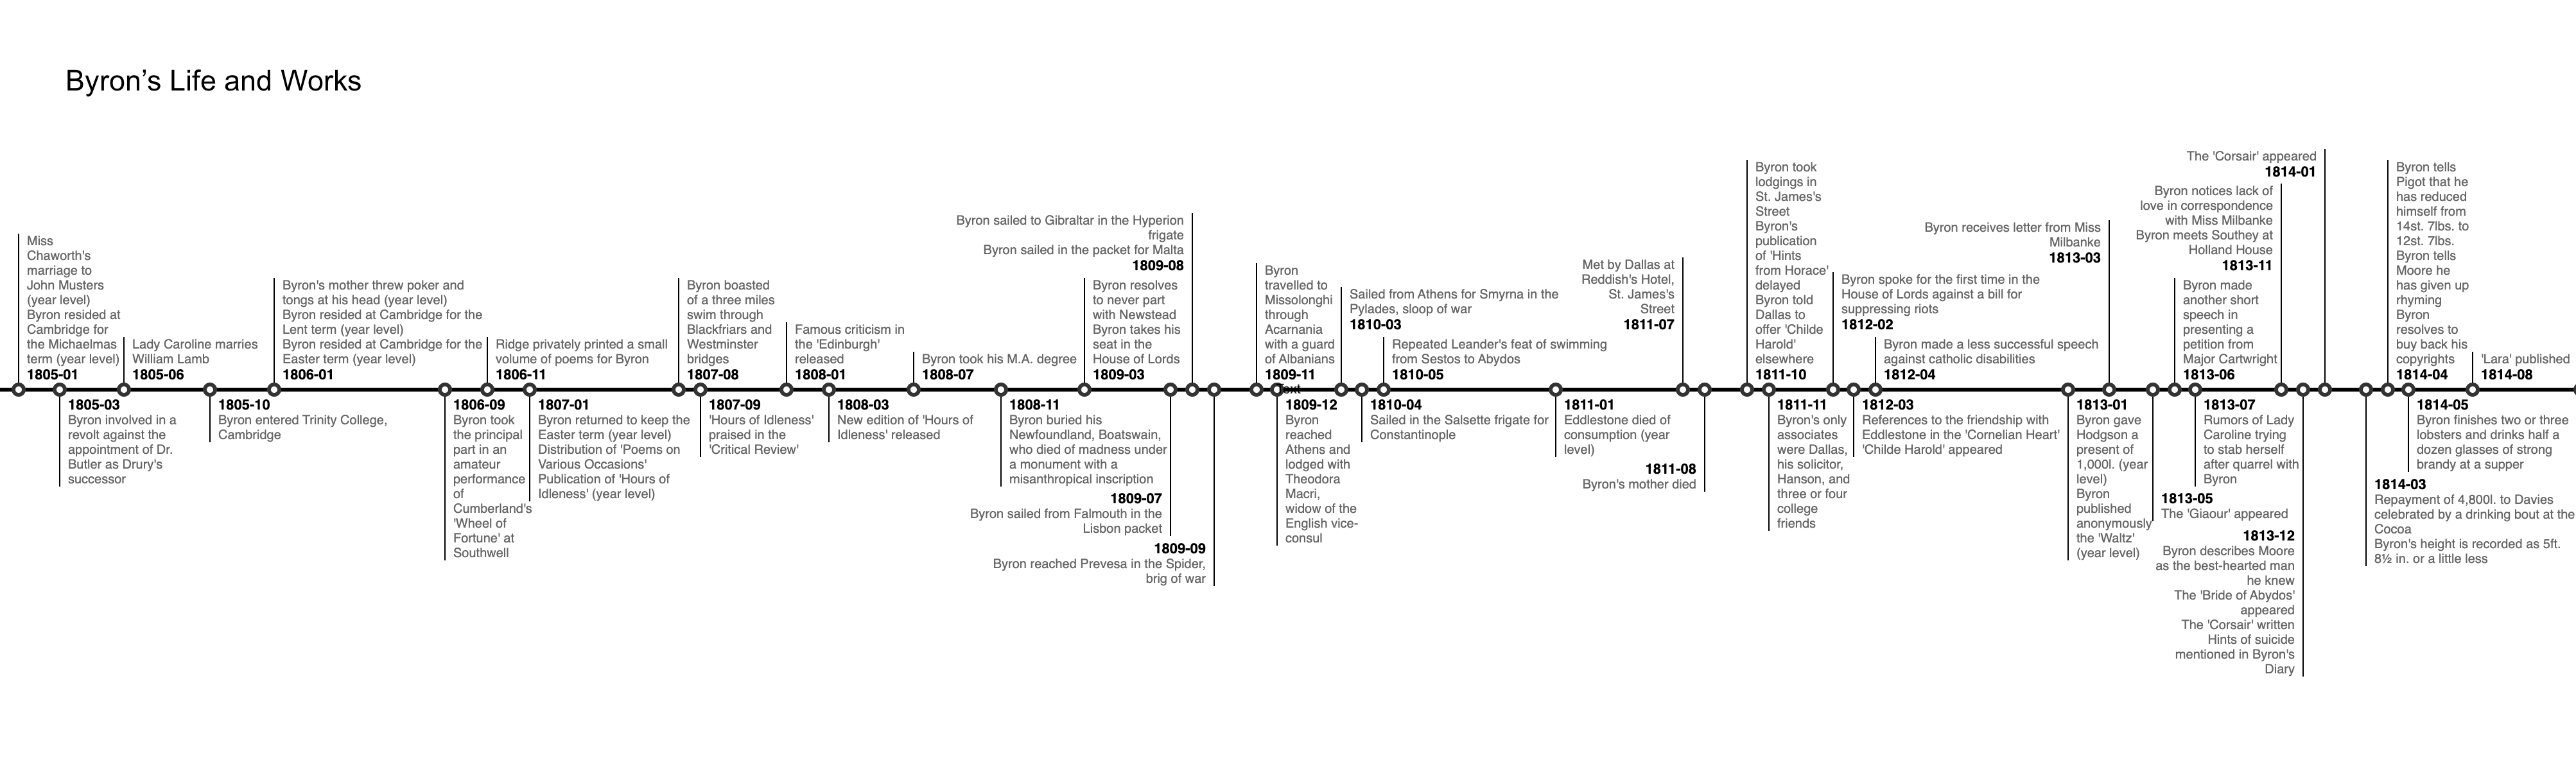
It’s a python package that uses OpenAI's gpt-3.5-turbo to extract and then visualise (using the d3-milestones package) historical time lines from pdf documents.
Here are some example outputs:
The life and works of Lord Byron extracted from the National Dictionary of Biography.
A history of the world since the American War of Independence extracted from the last thirteen chapters of H G Wells A Short History of the World.
New training courses in generative AI and causal reasoning
We have two new workshops:
Large language models from the ground up: taking you from the simplest of language generation models right up to the current LLM beasts.
Causal analysis: Nearly all business questions are about what causes what. We use Judea Pearl’s ladder of causation to demystify statistical analysis.
Note: I charge by the session, so assemble a large group and this could be a really effective use of your training budget!
If you’ve enjoyed this newsletter or have any other feedback, please leave a comment.
In the case of A/B testing where the outcome is binary, the Bayesian formula is well known. Given a uniform prior it consists of a Beta distribution with parameters (x+1) and (n-x+1) - x being the number of success and n the number of trials.
And these hassles can be considerable given that we need to speculate about the distributions of the original quantities.
As someone who has spent a lot of time working on A/B tests, the Bayesian approach sounds very appealing: "No more talk of p-values, confidence intervals, null hypotheses, power, minimum detectible effect, type one and type two errors. No more blank faces. No more embarrassing attempts to put the inexpressible into words!"
Where is a good place to start with that, could you recommend any good practical entry level books / courses to get started? (I'm more interested in the practicals than the hard maths)
Hi Fred, it really is so worth it. I recently set up Bayesian A/B testing for an online fashion retailer and they were very happy.
The best place to start if you want a good but very accessible introduction to Bayesian statistics is chapter 11 of David Spiegelhalter's The Art of Statistics (the whole book is worth getting in any case.) Most of the effort involves understanding how the Bayesian approach differs from the frequentist approach (and why it is so much easier to explain). After that the code and the maths are relatively easy. I don't know what your preferred tools are but here's a link to a gist containing the python code for an A/B test for the difference between two proportions: https://gist.github.com/coppeliaMLA/9f2c0e4585e4fa88378cce9d09a14ba1
Shameless plug but I also do training and mentoring on this topic.